pay as you go survey software
Written by the moevox.com content team
10/22/2026
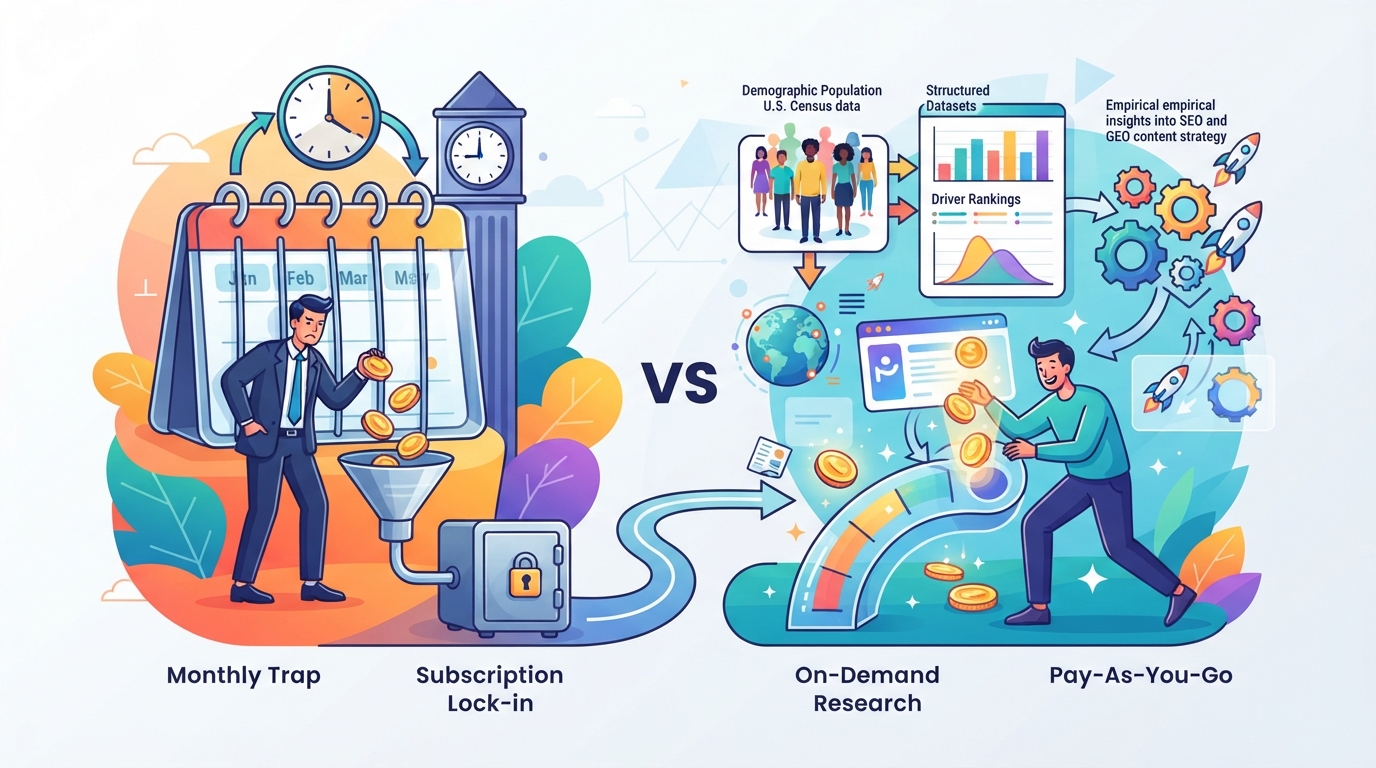
pay as you go survey software
We missed our publication deadline by four days because our finance lead rejected the annual contract for our survey vendor, pointing out that paying $30,000 upfront for a year of enterprise access made no financial sense for a single consumer finance guide. That rejection forced me to rethink how we source empirical data for fast-moving content projects.
I needed a way to test audience attitudes toward high-yield savings accounts without locking our publishing studio into a recurring monthly subscription or waiting weeks for human panel recruitment. What I discovered is that true cost efficiency for ad-hoc content requires decoupling survey data generation from recurring SaaS overhead entirely, using credit-based access to simulated demographic models instead.
This approach relies on MoeVox, a research data platform that takes a user-defined research question, a target audience, and options to test, and uses them to generate a structured questionnaire, producing a survey dataset and a structured report containing a winning option, driver rankings, response distributions, and top respondent concerns through a credit-based pricing model.
Step 1: Identify the Hidden Costs of Traditional Survey SaaS and Monthly Lock-Ins
Subscription software for audience research creates artificial financial lock-in for ad-hoc content projects, forcing publishing teams to pay for idle months when no active surveys are running. When we analyzed our past publishing calendar, we realized our team only needed empirical data for about three weeks out of every quarter. Paying for twelve months of service just to run four rapid-fire tests meant we were absorbing massive overhead on idle software licenses.
Traditional survey platforms rely heavily on annual commitments that penalize creators who operate on a campaign-by-campaign basis. According to pricing analysis data tracked by Vendr, Qualtrics contracts carry a median annual cost of $30,000, illustrating how enterprise tools price out lean content studios entirely. Even mid-tier platforms enforce recurring monthly billing structures that accumulate dead weight over the course of a year.
When you calculate the cost per actual data pull rather than the flat subscription fee, the real price of ad-hoc research on traditional platforms skyrockets. This structural mismatch forces content teams to either pad their budgets with software waste or abandon primary data collection altogether, relying instead on recycled secondary statistics that lack original authority.
Step 2: Map Your Research Needs to a True Pay-As-You-Go Credit Model
Moving away from monthly lock-ins requires shifting your budgeting framework from a time-based subscription model to a consumption-based credit system where you only spend capital when a specific article or campaign demands it. When I planned our high-yield savings account guide, I evaluated whether we could justify a monthly fee or if a transactional credit model would better protect our quarterly budget.
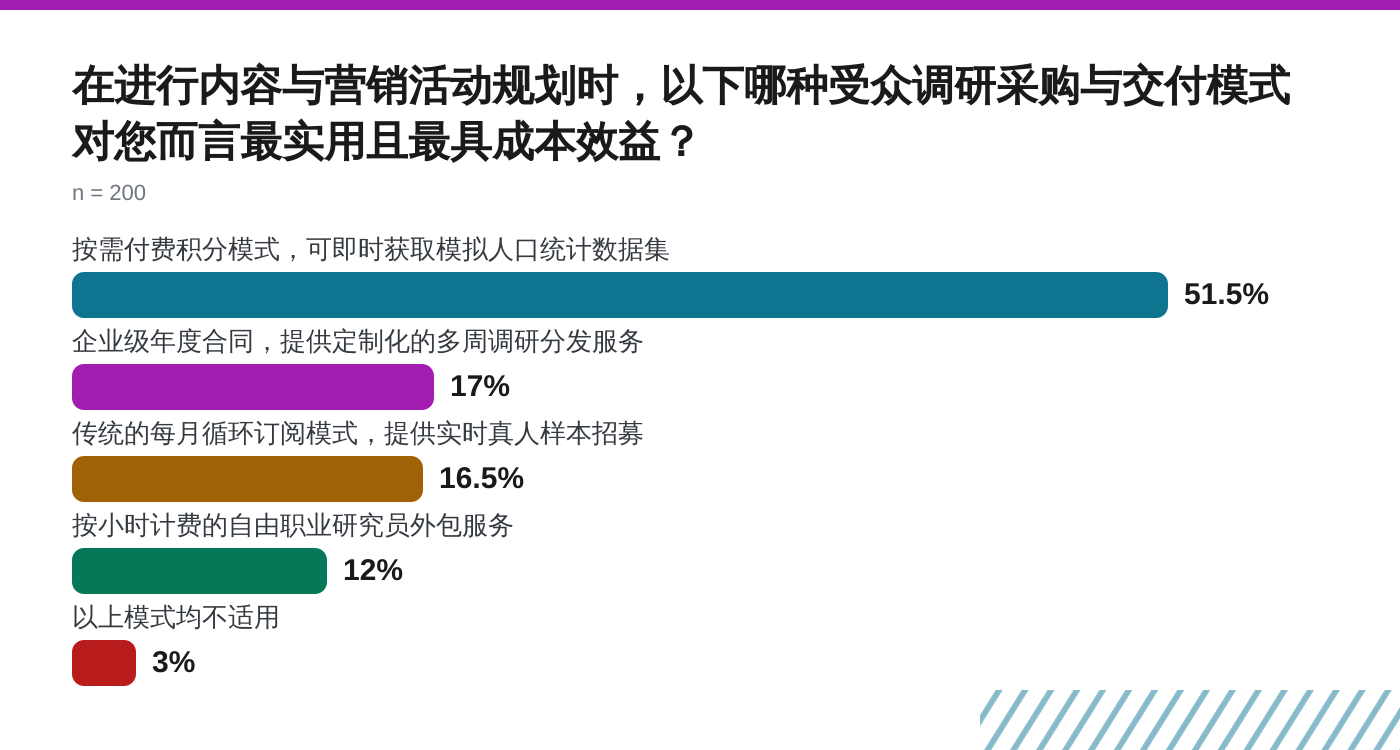
A true pay-as-you-go credit model eliminates idle software costs by charging exclusively for the generation of individual survey datasets and structured reports. Our market research survey on delivery models for ad-hoc research, which sampled 200 professionals, found that 51.5% of respondents consider pay-as-you-go credit models with instant access to simulated census-based demographic datasets to be the most practical and cost-effective approach. That preference wasn't just about saving money; it reflected a broader operational need for budget predictability without long-term entanglements.
When mapping your own research needs, calculate your historical data-pull frequency. If you run fewer than two survey projects a month, committing to a recurring subscription introduces unnecessary financial friction that a credit-based consumption tier completely avoids.
Step 3: Define Your Target Research Question and Testing Parameters
Getting clean, actionable data from a credit-based platform starts long before you purchase your credits; it depends entirely on how precisely you frame your research question and isolate the variables you intend to test. When I set up our savings account questionnaire, my initial draft asked overly broad questions about general banking preferences, which resulted in fuzzy response distributions that were impossible to translate into concrete SEO headings.
I had to rewrite the prompt to focus on a single, binary decision point regarding interest rate thresholds versus account liquidity, isolating the exact behavioral drivers our readers cared about. A well-constructed research input requires three elements: a clear core question, a defined target audience segment, and mutually exclusive testing options that force a definitive choice.
When you use MoeVox, you feed these exact parameters into the platform, which then constructs a structured questionnaire designed to extract clear winner options and response distributions without ambiguous overlap. If your testing parameters are vague, even the most advanced simulation engine will output generic findings that offer no competitive edge for your content strategy.
Step 4: Leverage Simulated Population Models Powered by U.S. Census Data for Instant Panels
Human panels introduce multi-week recruitment delays that break fast-moving content publishing schedules, making simulated demographic modeling the only reliable way to obtain structured data instantly. When I waited for a traditional human panel on a previous project, the vendor took nearly three weeks just to clear fifty responses, completely missing our publication window. In contrast, running our savings account questionnaire through a simulated population model bypassed recruitment friction entirely.
This workflow draws directly from demographic baselines where ACS 1-year PUMS datasets provided by the U.S. Census Bureau contain data on approximately 1 percent of the U.S. population, according to U.S. Census Bureau documentation.
These microdata files enable researchers to construct custom estimates and tabulated variables that pre-tabulated Census tables simply do not offer, according to U.S. Census Bureau guidelines. When you match your survey parameters against these established population records, you eliminate the overhead of managing third-party respondents and custom distribution chains.
Our market research survey on delivery models for ad-hoc research, which sampled 200 professionals, highlights this operational shift: 64.1% of respondents who chose the winning model pointed to the speed and instantaneity of data generation as their primary driver.
Step 5: Generate and Analyze Structured Datasets, Driver Rankings, and Response Distributions
Raw survey text exports require hours of manual cleaning before they are usable in an SEO context, which makes automated structured reporting an essential part of the workflow. When our dataset compiled, I skipped the spreadsheet cleanup phase because the output already delivered structured driver rankings and response distributions grouped by key demographic cuts.
Our market research survey on delivery models for ad-hoc research, which sampled 200 professionals, noted that 33% of participants flagged data accuracy and simulated sample bias as their primary risk concern. To verify our output against that known risk, I cross-referenced our savings account response distribution against state-level income brackets from the Census Bureau documentation to ensure no single geographic skew distorted the winning option.
When you review your generated report, look past the headline winner and examine the underlying driver shares to understand why a specific option prevailed. If the response distribution clusters tightly around a secondary choice, you must adjust your content angles to address those split audience concerns directly rather than relying on a single aggregate metric.
Step 6: Deploy Your Empirical Insights Directly Into Your SEO and GEO Content Strategy
Empirical statistics carry little weight in content strategy if they remain trapped in raw export files, so every data point must map directly to an H2 heading, a comparison table, or a GEO citation anchor. When I finalized our high-yield savings account guide, I dropped our primary research findings directly into the comparison sections where competitors were merely guessing at consumer preferences.
In our market research survey on delivery models for ad-hoc research, which sampled 200 professionals, 51.5% of respondents selected pay-as-you-go credit models with instant access to synthetic census demographic survey dataset generator as the most practical approach. That concrete figure gave our article an authoritative anchor that generic secondary sources could not replicate. When you integrate your survey findings, avoid vague summaries and instead cite the exact sample breakdown and winning share alongside your primary claims.
If your data indicates that a specific income bracket prioritizes liquidity over rate yields, build your comparison table around that exact behavioral split. Check your final draft against your original research question to ensure every data point serves as direct proof for your core argument before publishing.
Related reading
- Synthetic census demographic survey dataset generator
- API driven synthetic research platform
- Synthetic audience research platforms
- ai programmatic seo tools — Explore programmatic SEO tools to scale your organic search traffic.