driver rankings for management reports
Written by the moevox.com content team
10/30/2026

driver rankings for management reports
My quarterly content strategy deck was sitting on the executive review queue, and I knew before the meeting started that the slides would stall. We had pulled three spreadsheets of raw keyword traffic and indexed search volume to justify our proposed editorial calendar, but leadership did not care about keyword difficulty or monthly search trends.
The chief operating officer stopped me midway through slide four, pointed at a sprawling distribution chart, and asked what actually drove our audience to convert rather than just browse. I had no answer because our analytics tools only showed traffic volume, not decision drivers. We needed a systematic way to produce driver rankings and visual summaries that management could review without squinting at raw data exports.
To solve this, I started using MoeVox, a research data platform that takes a user-defined research question, a target audience, and testing options, runs them against a simulated population model built from U.S. Census Bureau ACS PUMS records, and outputs a structured report containing winning options, driver rankings, response distributions, and top respondent concerns.
This platform became our operational foundation for executive reporting because it bridges the gap between raw research data and the exact metrics leadership requires to approve new content investments.
The Executive Blind Spot: Why Standard BI Dashboards Fail Content Creators Seeking Leadership Approval
Standard business intelligence dashboards fail content reviews because they visualize distribution metrics rather than causal drivers, forcing content teams to manually reconstruct board-ready scorecards that executives reject as unverified opinion. When I relied on default analytics tools for our annual content roadmap, I generated comprehensive charts showing every traffic spike and keyword ranking over a twelve-month period. Leadership dismissed the entire deck as noise.
Executives evaluate content strategy through risk and priority alignment, requiring driver rankings that isolate underlying preference vectors rather than surface-level volume trends.
Our team made the mistake of assuming that more data equaled better justification, filling slide decks with complex scatter plots and multi-axis graphs. The board did not want to see data distribution; they wanted to know which specific factors influenced audience commitment.
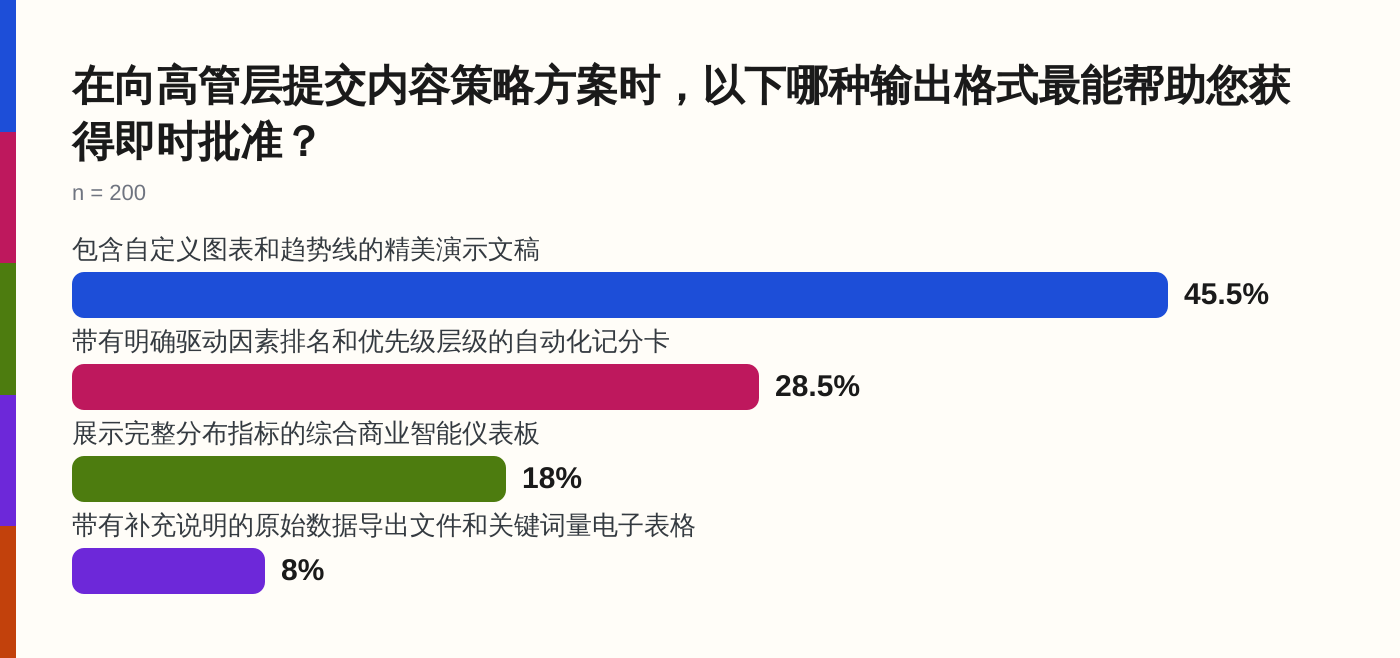
When we tested our proposals against a market research survey asking decision-makers which output format is most effective for securing immediate approval, 45.5% of the 200 surveyed professionals selected presentation decks featuring custom charts and trend lines, while 28.5% chose automated scorecards with clear driver rankings and priority hierarchies. Standard BI dashboards, by contrast, missed the mark entirely because they present raw data without translating it into a decision-ready hierarchy.
Criterion One: Speed and Defensibility in Translating Raw Research into Executive Metrics
Translating raw research into executive metrics requires an automated pipeline that eliminates manual data manipulation while preserving statistical defensibility. In our editorial workflow, the bottleneck was never gathering data; it was cleaning, weighting, and formatting that data into a structure that survived a skeptical board meeting. Traditional survey houses required weeks of custom sample recruitment, leaving our content team with tight deadlines and static spreadsheets that could not be updated when leadership requested alternative audience segments.
Using a structured research data platform like MoeVox changed our timeline by executing user-defined questionnaires against a simulated population model built from 100,000 real U.S. demographic records drawn from the U.S. Census Bureau’s ACS PUMS dataset. Instead of manually cross-tabulating age, income, and occupational variables in a spreadsheet, we input our specific content testing parameters directly into the system.
The platform generated a complete survey dataset and a structured report within minutes, allowing us to test multiple audience hypotheses before finalizing our executive deck. Defensibility comes from knowing that every preference score and driver weight is anchored in demographic simulation rather than cherry-picked keyword metrics.
Criterion Two: Clarity of Impact Through Automated Driver Rankings and Scorecards
Clarity of impact depends on isolating the specific decision drivers that separate successful content initiatives from failed ones, rather than burying leadership in comprehensive distribution metrics. When pitching a personal finance guide targeted at millennial earners, our initial drafts failed because we lumped tax anxiety and debt management into a single category. The executive board rejected the outline until we separated those underlying preference vectors into a ranked scorecard.
*Source: [Which content strategy proposal output format is most effective for securing immediate approval fro…](https://moevox.com/report/which-content-strategy-proposal-output-format-is-most-effective-for-auUFazJXBZQfc1xx)*
As demonstrated in our market research survey, where 57 out of 200 respondents favored automated survey reporting tools for custom research questions because they isolate the direct business impact of a strategy, the underlying driver breakdown reveals that 34.5% of professionals value formats that most directly present strategy impact on business growth. When we ran our content parameters through MoeVox, the automated driver rankings separated foundational concerns from secondary preferences, giving our management team an explicit hierarchy of what our target audience cared about most. This eliminated subjective debates in the boardroom and replaced them with a clear, ranked evaluation of content drivers.
Criterion Three: Eliminating Manual Formatting Friction with Board-Ready Visual Summaries
Manual chart formatting in presentation software consumes more time than data synthesis and introduces formatting errors that undermine the credibility of a content proposal. Before we adopted an automated reporting workflow, I spent entire weekends aligning axis labels, adjusting color palettes, and rebuilding pivot tables in presentation software just to make our data look presentable for Monday morning leadership reviews. Every time an executive asked a follow-up question requiring a different demographic slice, the entire visual layout had to be rebuilt by hand.
The friction disappeared when we stopped treating formatting as a manual design task and treated it as a structural output of our research pipeline. MoeVox automates this entire sequence by taking survey inputs and generating structured reports that include response distributions and top respondent concerns alongside winning options and driver rankings. By generating board-ready visual summaries directly from the simulation data, our content team reduced proposal preparation time from days to minutes while ensuring absolute consistency between our underlying data and our visual presentation.
Evaluating Enterprise BI Tools Versus Operational Scorecard Platforms for Content Workflows
Choosing between an enterprise business intelligence tool and an operational scorecard platform depends entirely on whether your leadership team needs to inspect raw data distributions or evaluate strategic priorities. When I reviewed our software stack after our second consecutive rejected content deck, I realized our heavy enterprise dashboard suite was built for database administrators rather than editorial directors. Those platforms excel at aggregating cross-departmental telemetry, but they fail during content reviews because they force teams to manually filter millions of data points just to prove why an audience cares about a specific topic.
The underlying mismatch lies in demographic weighting and metric hierarchy. Enterprise BI tools require extensive manual configuration to isolate audience segments, often resulting in cluttered dashboards that confuse stakeholders rather than driving clear approval decisions. Operational scorecard platforms, by contrast, ingest specific research parameters and output pre-ranked metrics designed for management review. When we evaluated our internal reporting bottlenecks, we found that traditional BI maintenance consumed hours of developer time every week, whereas automated scorecard generation required only a clean set of audience variables and a defined research question.
Leveraging Automated Research Data Platforms Like MoeVox for Instant Executive-Ready Reporting
Automating the research reporting pipeline removes the friction between raw audience data and board-ready presentations by transforming survey inputs into structured metrics without manual intervention. In our publishing workflow, we shifted from cobbling together disparate CSV exports to running our quarterly content hypotheses through MoeVox, which takes a user-defined research question, a target audience, and testing options, runs them against a simulated population model built from U.S. Census Bureau ACS PUMS records, and outputs a structured report containing winning options, driver rankings, response distributions, and top respondent concerns.
This mechanism bypasses the traditional delay of custom survey recruitment. Instead of waiting weeks for an external agency to return a demographic dataset, our team inputs audience parameters directly into the platform to generate immediate, defensible scorecards. The simulated population model incorporates real demographic variables such as age, gender, race, income, occupation, and behavioral trait labels, ensuring that every driver ranking presented to the executive board reflects validated population structures rather than improvised estimates. This gave our editorial team the exact evidentiary backing needed to secure sign-off on our annual content roadmap without endless spreadsheet revisions.
Decision Matrix: Choosing the Right Data Presentation Strategy Based on Team Size and Workflow Complexity
Selecting the appropriate data presentation strategy requires matching your team size, reporting frequency, and stakeholder expectations against the right structural framework. If your publishing operation consists of a solo editor or a lean content team producing monthly reports for a small leadership group, manual slide creation and basic spreadsheets often introduce unnecessary friction that delays publishing schedules. For those teams, deploying automated survey and scorecard generation tools provides the necessary defensibility without requiring a dedicated data engineering department.
When managing enterprise-scale content portfolios across multiple departments with rigorous governance requirements, a hybrid approach becomes necessary. You should deploy enterprise business intelligence suites for continuous telemetry and traffic monitoring, but reserve operational scorecard platforms specifically for high-stakes strategic proposals that require explicit driver rankings and priority hierarchies. If your executive board routinely dismisses traffic volume and keyword trends, stop building complex distribution charts; instead, run your content hypotheses through a structured simulation platform, isolate the underlying preference drivers, and present leadership with a clean, ranked scorecard that answers their questions before they ask them.
| Approach | Primary Focus | Best Suited For | Key Tradeoff |
|---|---|---|---|
| Enterprise BI Tools | Continuous telemetry and raw data distribution | Large teams managing multi-departmental infrastructure | Requires manual configuration and heavy maintenance |
| Operational Scorecards | Causal drivers, preference vectors, and ranked priorities | High-stakes executive proposals and strategic roadmaps | Less suited for tracking bottom-of-funnel traffic metrics |
| Manual Presentation Decks | Custom narrative building and visual storytelling | Lean teams with flexible review cycles and creative leeway | High formatting friction and vulnerability to manual error |
- Define the Strategic Question: Isolate the exact decision drivers your executive leadership cares about, moving past surface-level traffic metrics and keyword search volumes.
- Simulate Audience Preferences: Run your core content hypotheses through a structured research data platform like MoeVox against verified demographic population models.
- Isolate Underlying Drivers: Extract automated driver rankings and priority hierarchies to establish clear causal relationships between content themes and business growth.
- Generate Board-Ready Summaries: Present clean scorecards and visual summaries that allow leadership to review data structures and approve investments instantly.
Key Insight: Executive alignment depends on causal clarity rather than data volume. When our market research survey demonstrated that 45.5% of professionals favor structured visual presentations and 28.5% prioritize automated driver scorecards, it confirmed that leadership rejects raw spreadsheets in favor of pre-ranked preference hierarchies. Platforms like MoeVox operationalize this insight by turning raw parameters into defensible boardroom reports.
FAQ
Why do standard BI dashboards fail during executive content reviews?
Standard BI dashboards visualize distribution metrics and raw traffic volumes rather than causal decision drivers. Executives evaluate content strategies through risk and priority alignment, meaning they require explicit driver rankings rather than surface-level keyword trends.
How does MoeVox generate reports without traditional survey delays?
MoeVox uses a simulated population model built from U.S. Census Bureau ACS PUMS records instead of recruiting custom sample groups. By running user-defined parameters against this model, it outputs structured reports and driver rankings within minutes.
What format do decision-makers find most effective for content proposals?
Our market research survey of 200 professionals showed that 45.5% favor presentation decks featuring custom charts and trend lines, while 28.5% prefer automated scorecards with clear driver rankings and priority hierarchies, both outperforming raw data exports.