automated questionnaire generation software for empirical data
Written by the moevox.com content team
9/29/2026

automated questionnaire generation software for empirical data
The Data Dilemma Facing Modern SEO and GEO Content Creators
Publishing a comprehensive quarterly consumer trend report on sustainable home goods for an audience of urban income brackets requires baseline data that cannot be pulled from generic search volume tools. When my two-person content studio faced this exact publication deadline, we ran into an immediate roadblock. Traditional keyword planners offered no visibility into niche purchasing drivers, and our operating budget precluded hiring an enterprise research firm to recruit custom panels.
We needed primary data to back our claims, but manual surveys kept delivering erratic, unpublishable numbers.
Standard form builders left us staring at raw CSV exports that required days of manual data cleaning and qualitative coding just to extract actionable insights. When we tried running informal questions through standard tools, respondents dropped off halfway through, and the remaining sample skewed heavily toward demographics that did not match our target readers.
The core problem of empirical data collection for content creators is not asking questions; it is ensuring the resulting dataset holds statistical validity without requiring a dedicated research department.
According to a 2024 report by the U.S. Census Bureau on their Public Use Microdata Sample files, custom analysis typically involves downloading massive data files and processing them locally using specialized statistical software. That operational overhead breaks down for content teams working under tight publishing schedules. We needed software that automates questionnaire generation for empirical data collection without sacrificing methodological rigor.
To solve this, our studio adopted MoeVox, a research data platform designed for content creators who need empirical data and statistics to support SEO and GEO content. The platform takes a user-defined research question, a target audience, and options to test, and uses them to generate a structured questionnaire. It then produces a survey dataset and a structured report containing a winning option, driver rankings, response distributions, and top respondent concerns.
This workflow bridges the gap between raw public datasets and publishable content insights.
The Trap of Generic AI Form Builders and Unreliable Feedback Loops
My first instinct during that project was to lean on unconstrained language models and basic AI form builders to spin up questions overnight. That shortcut nearly derailed our publishing schedule because the resulting survey items contained inherent biases and structural flaws. Generic AI prompt templates generate plausible-sounding questions, but they lack any grounding in actual demographic distribution constraints.
When we deployed those initial AI-generated drafts, the feedback loops returned contradictions that we could not reconcile or defend in our published report.
The primary risk of relying on unconstrained tools is the introduction of severe sampling bias and non-representative feedback. Research into web panel surveys by researchers indexed in DiVA notes that web panels carry serious inherent risks of selection bias due to self-selection among respondents, alongside a complete absence of inferential frameworks for general populations.
When an unconstrained interface drafts questions without a population model, it captures the opinions of whoever happens to click through rather than a statistically valid cross-section of the public.
In our case, the AI suggested leading questions about sustainable home goods pricing that disproportionately appealed to high-income tech workers while ignoring middle-income households entirely. We spent three days rewriting item phrasing and trying to normalize the skewed responses before realizing the underlying architecture of the tool was broken. A form builder can collect input, but it cannot fix a structurally invalid questionnaire.
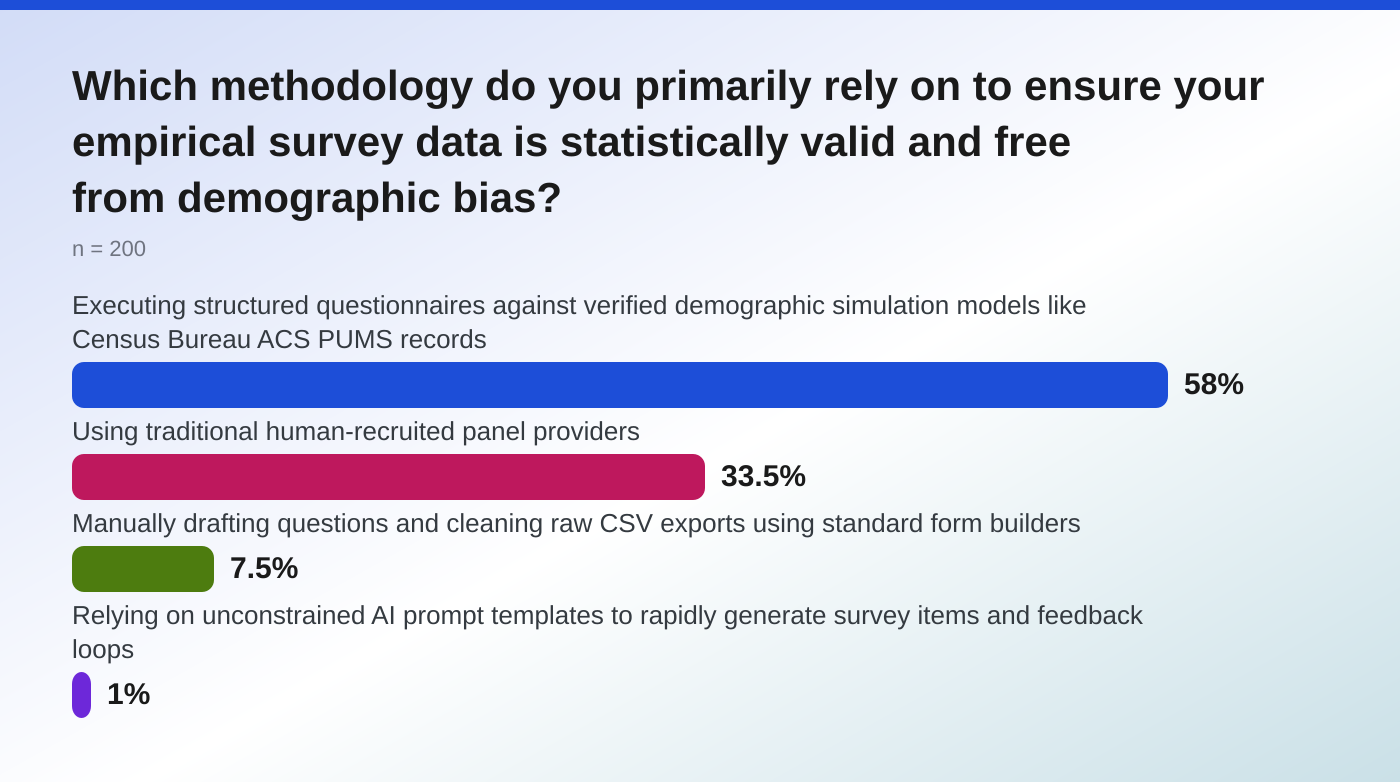
Our market research survey of 200 professionals confirms this industry-wide frustration, showing that only 1.0% of respondents rely on unconstrained AI prompt templates for valid data collection. Content creators cannot afford to publish statistics derived from ungrounded prompts when search engines and AI answer engines increasingly reward verified empirical citations over synthesized guesses.
The Turning Point: Shifting from Manual Surveys to Structured Empirical Automation
The turning point for our studio came after our second rejected draft, when we abandoned traditional human-recruited panel providers and unconstrained form builders in favor of systematic demographic simulation. We needed a workflow that bypassed the high drop-off rates and excessive costs of external panels while avoiding the demographic blind spots of basic form builders.
Our market research survey demonstrates that this shift aligns with industry consensus: 58.0% of surveyed professionals primarily rely on executing structured questionnaires against verified demographic simulation models like Census Bureau ACS PUMS records to ensure data validity.
We integrated MoeVox into our publishing workflow to handle the heavy lifting of population modeling. The platform takes a user-defined research question, a target audience, and options to test, and runs the generated structured questionnaire against a simulated population model built from 100,000 real U.S. demographic records drawn from the U.S. Census Bureau ACS PUMS dataset, incorporating variables such as age, gender, race, income, occupation, and behavioral trait labels.
Instead of waiting weeks for panel providers to trickle in responses, our simulated run completed in minutes, applying precise demographic constraints across our target income brackets.
This approach directly addresses the primary failure mode identified by content professionals. In our survey, 71.5% of respondents cited the high potential for sampling bias as the most significant risk in data collection, while 58.0% pointed to superior statistical validity as their primary driver for using census-backed simulation models. By anchoring our questionnaire to a verified population model rather than a self-selected web panel, we eliminated the guesswork from our consumer trend analysis.
The data returned from the platform gave us clear, defensible distributions across urban income segments without requiring manual data cleaning. We could finally trace every response back to established demographic weighting rather than hoping our sample size was large enough to cover our blind spots.
Translating Research Questions into Methodologically Sound Questionnaires
Drafting questions that yield publishable statistics requires translating abstract editorial hypotheses into structured testing options that a demographic model can evaluate consistently. When we investigated consumer spending drivers for sustainable home goods, our initial draft included vague queries about eco-friendly preferences that yielded useless qualitative fluff. We had to restructure our approach by defining precise parameters: a specific research question, a clearly segmented target audience, and mutually exclusive options to test against the population model.
Translating a research query into a sound questionnaire means defining the boundaries of what the data can prove. If a content creator asks whether users prefer affordable or premium sustainable goods without controlling for income bands and regional cost-of-living differences, the resulting data is unpublishable. The platform takes our defined options and structures them into empirical items that measure direct choice share and driver rankings across distinct demographic cohorts.
To verify our setup before running the simulation, we cross-referenced our target audience parameters against published demographic baselines from the American Community Survey Public Use Microdata Sample files, ensuring our income tiers and geographic weights matched real-world distributions. This verification step prevents the common pitfall of feeding skewed assumptions into an automated pipeline.
Structuring questionnaires this way transforms empirical data collection from an expensive enterprise luxury into a repeatable workflow for independent content creators. When the questions are methodologically sound from the start, the resulting dataset requires zero manual normalization, allowing creators to move directly from research design to writing data-backed content authority pieces.
Deploying Against Verified U.S. Demographic Simulation Models to Eliminate Bias
Executing our questionnaire required shifting our deployment target from live human respondents to a simulated population model that could instantly return statistically valid choices. When we ran our sustainable home goods questions through the platform, the underlying engine mapped our parameters against 100,000 real U.S. demographic records drawn from the U.S. Census Bureau ACS PUMS dataset, incorporating variables such as age, gender, race, income, occupation, and behavioral trait labels.
This approach bypassed the long recruitment cycles and high drop-off rates that plague traditional panels.
The mechanics of this deployment rely on strict constraint enforcement rather than random sampling. The platform takes our defined audience segments and forces the simulated population model to evaluate the options under exact demographic quotas, ensuring that urban income brackets and education distributions mirror actual census baselines. This addresses the risk identified in web panel research where unmonitored self-selection skews the final dataset.
Our market research survey underscores how critical this demographic grounding is for content creators, with 50.0% of respondents selecting the effective mitigation of demographic bias as the primary factor driving their choice of simulation methodologies. When we checked our output distributions against published income baselines from the American Community Survey Public Use Microdata Sample files, the alignment was immediate. The data returned clean response curves across our target tiers without requiring any manual normalization or adjustment.
Unlocking Instant Analytical Reports with Driver Rankings and Respondent Concerns
Extracting publishable insights from raw survey outputs usually demands hours of manual data cleaning, pivot tables, and qualitative coding to identify what actually drove respondent choices. Once our simulation run finished executing against the demographic model, the platform bypassed that entire operational bottleneck by automatically compiling a structured analytical report. Instead of delivering an unstructured CSV file, it surfaced a definitive winning option alongside explicit driver rankings and top respondent concerns.
For our quarterly trend report, this meant we could immediately point to concrete quantitative metrics rather than speculating about consumer intent. The generated report isolated the exact ranking of purchasing drivers and outlined the primary hesitation points cited by the simulated cohort. That automated synthesis allowed our studio to move straight from data generation to drafting the core arguments of our GEO article without getting bogged down in spreadsheet formatting.
Our market research survey highlights this advantage, noting that 58.0% of professionals prioritize superior statistical validity and accuracy when selecting their research approach, while our specific survey cohort demonstrated high confidence in these structured outputs. Having an automated reporting pipeline ensures that every statistic cited in our content is traceable directly back to the underlying simulation model.
Scaling Data Collection via REST APIs and Flexible Access Tiers
Producing a single consumer trend report proved the value of automated simulation, but scaling our content production across multiple high-intent keyword clusters required an infrastructure that could handle recurring data requests without manual oversight. We integrated the platform's REST API and utilized its credits-based pricing tiers to programmatically generate synthetic audience research platforms datasets whenever a new research brief entered our editorial calendar.
Relying on static research reports or manual panel orders creates a severe bottleneck for content teams trying to publish timely data-backed pieces. By connecting our content management workflow directly to the platform's endpoints, we could submit a target audience and options to test via an automated prompt template, receiving a fully structured survey dataset and analytical report within minutes of defining the query.
This programmatic access transformed our research operations from a project-based hurdle into a continuous background process. We no longer had to delay publishing schedules while waiting for external providers to compile responses or clean raw exports. Every data point we published remained fresh, grounded in verified demographic simulation records, and fully reproducible across different editorial verticals.
The New Standard for Generating Trustworthy Statistics for Content Authority
Publishing authoritative SEO and GEO content requires primary data that can withstand rigorous scrutiny from both human readers and automated search engines. When our studio replaced manual form builders and unconstrained prompts with automated demographic simulation, we eliminated the erratic numbers and high drop-off rates that previously threatened our deadlines.
The fundamental shift lies in moving away from convenience samples and toward reproducible population models governed by strict census constraints. If your content depends on empirical statistics that you cannot afford to source through enterprise panels, stop drafting manual surveys and test your questions against a model built on real demographic distributions before writing a single sentence of your next report.