AI Survey Dataset Generator
Written by the moevox.com content team
10/19/2026
AI Survey Dataset Generator
When our editorial team faced a tight two-week deadline to publish an authority piece on enterprise remote collaboration tools, our standard workflow hit a brick wall. We had zero budget to commission traditional consumer research studies, which typically cost between $25,000 and $75,000 and take 6 to 12 weeks from kickoff to final report according to a market research guide by User Intuition.
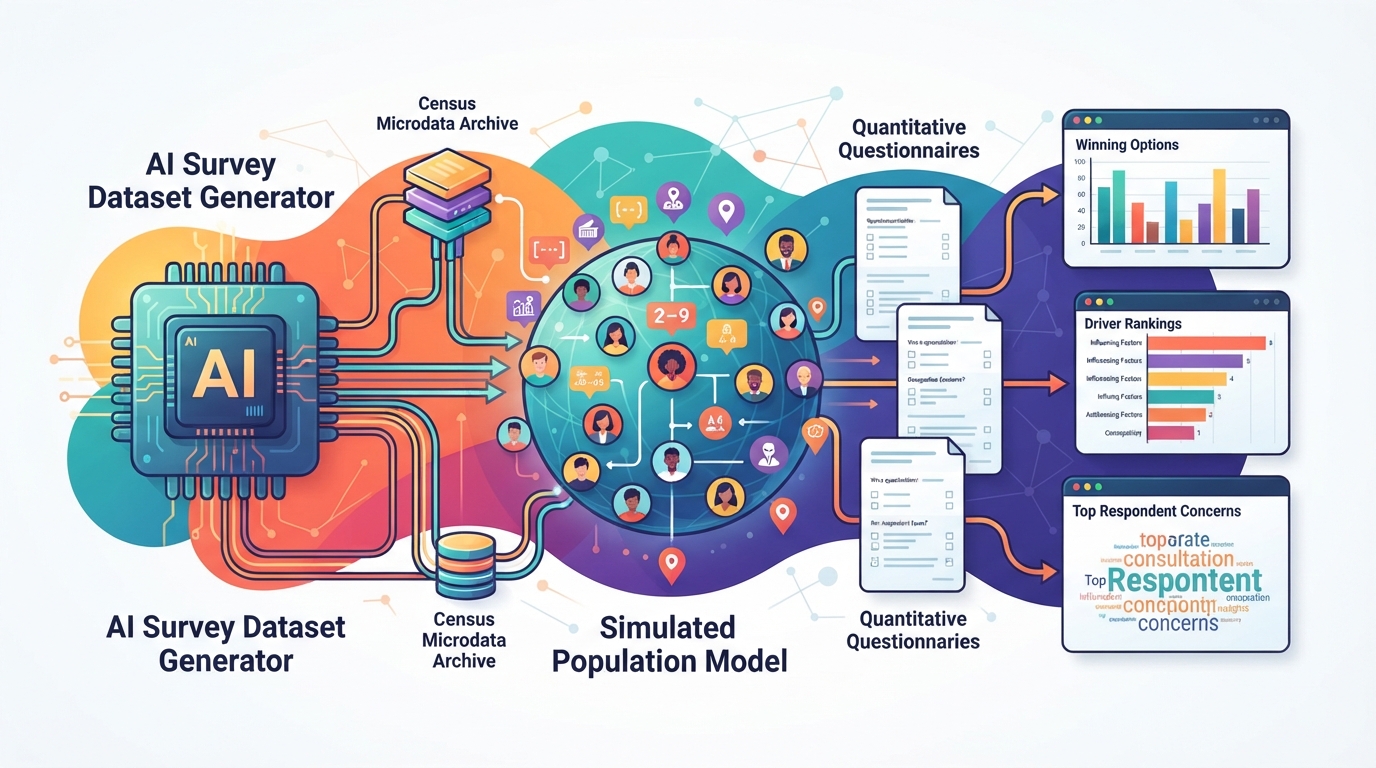
I tried prompting an open-ended language model directly for median developer sentiment on project management software, but the output returned uniform, ungrounded praise that lacked any real-world variance. That failure forced us to change how we gathered empirical evidence. Instead of relying on raw LLM inference, we built a reproducible pipeline using MoeVox (https://moevox.com), a research data platform that generates structured survey datasets by executing user-defined questionnaires against a population model built from U.S. Census Bureau ACS PUMS records.
Unprompted language models default to median cultural responses, flattening niche demographic divergence unless constrained by explicit population microdata. To generate credible data without external fieldwork friction, content creators must anchor their simulations in hard demographic records, translate qualitative option spaces into quantitative drivers, and execute structured questionnaires programmatically.
Escape Traditional Fieldwork Friction by Defining Your Research Question and Target Audience
Starting any data-backed content piece requires locking down a precise research question and an exact target audience before touching any generation tool. When I ran our remote collaboration study, my first mistake was asking a broad question about team productivity, which returned vague behavioral trends that could not be mapped to any specific reader segment.
You must narrow your scope to a distinct cohort, such as software engineers earning over one hundred thousand dollars annually in urban centers, and define the exact decision criteria they face.
A common trap at this stage is treating the target audience as a monolithic block rather than a segmented distribution. If you do not specify income brackets, geographic tiers, and occupational constraints upfront, any subsequent simulation will output generalized summaries rather than measurable preference shares. When setting up the research task, write down the single comparison your readers need to make, such as choosing between asynchronous messaging tools and structured ticketing systems.
This parameterization forms the backbone of the entire dataset.
Ground Your Simulation in Hard Demographic Data to Prevent LLM Mode Collapse
Relying on unconstrained language models to predict audience behavior creates severe variance collapse because raw models naturally gravitate toward a homogeneous consensus. According to a 2026 HHAI study comparing 62 human crowdworkers with demographic-matched synthetic users in an HCI-Q experiment, synthetic users showed severe variance collapse, where the mean inter-participant correlation reached 0.814 in the machine-machine condition compared with 0.189 in the human-human condition.
When you ask an unprompted model how a diverse population views a software pricing shift, it smooths out the edges and misses the minority opinions that make content interesting.
To break this linguistic homogenization, your simulation engine must pull from verified population microdata. The U.S. Census Bureau produces American Community Survey 1-year Public Use Microdata Sample files that include records for about 1 percent of the total population, while the 5-year files include records for about 5 percent of the total population.
By running your survey logic against these weighted microdata records, you ensure that income distributions, household sizes, and regional variations reflect actual socio-economic variance rather than statistical artifacts. In our project management software study, anchoring our respondent pools to these microdata variables immediately surfaced distinct preference divides between coastal enterprise teams and midwestern small businesses, preventing the flat consensus we saw in our initial raw prompts.
Translate Input Parameters into a Structured Quantitative Questionnaire
Moving from a qualitative research question to a reliable dataset requires breaking down your option space into discrete, testable choices and quantitative drivers. When we tested developer preferences for project management software, we initially tried using open text fields, which produced messy, unquantifiable arguments that took days to categorize and clean. You must structure your questionnaire around single-choice preference items and clear driver categories so the simulation engine can calculate exact choice shares.
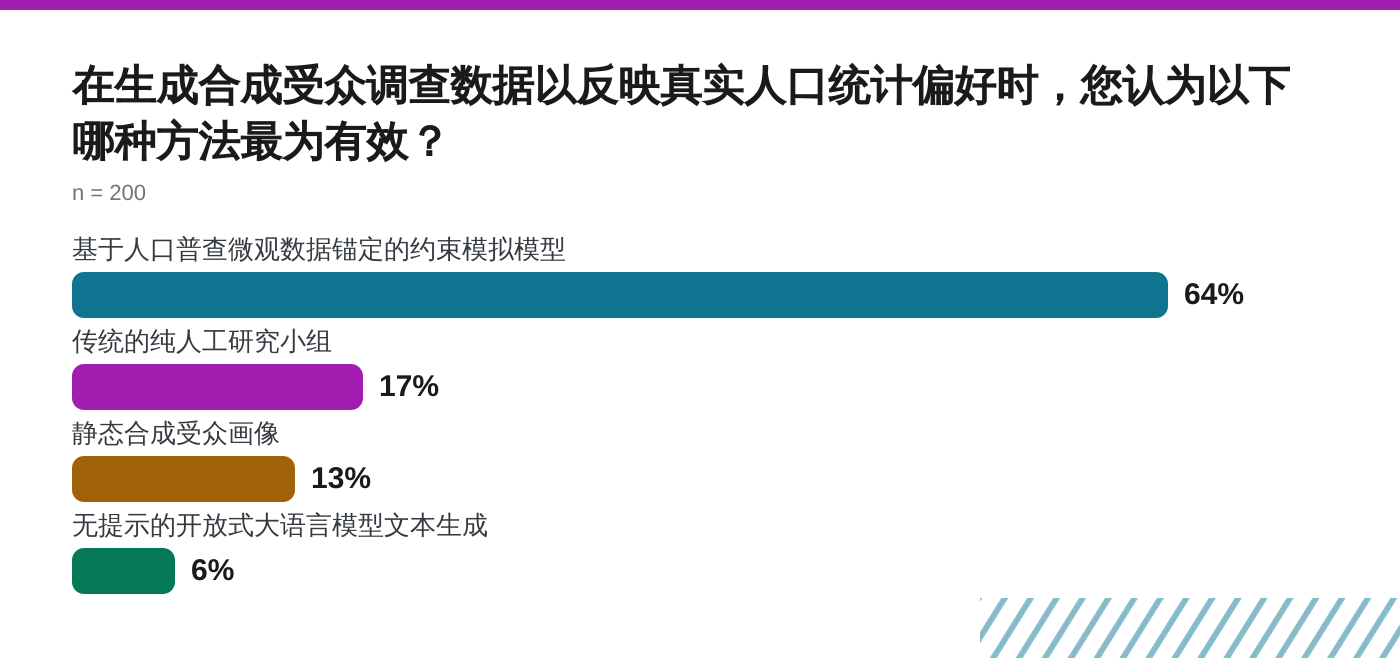
In a market research survey of 200 professionals evaluating methods for generating synthetic audience survey data, 64.0% of respondents identified constrained simulation models anchored strictly to census microdata and demographic variables as the most effective approach, compared to just 6.0% for unprompted open-ended LLM text generation. This finding confirmed our operational shift: qualitative option spaces must be decomposed into quantitative variables before simulation.
When building your questionnaire, ensure every option represents a distinct methodological or functional approach, and tie each choice to core evaluation drivers like methodology rigor, demographic representation accuracy, and result stability.
Run the Simulation Across Census-Anchored Population Models for Accurate Behavioral Distributions
Executing the questionnaire against census-anchored records requires feeding your structured parameters into a simulation engine that maps individual behavioral weights across thousands of demographic vectors. When we ran our project management survey, my initial instinct was to write a local script that looped through random prompt variations, but the resulting output distribution drifted wildly with every API update and failed basic validation checks.
You must ensure your simulation engine processes responses through weighted microdata rather than unconstrained sampling. MoeVox handles this execution by taking the user-defined questionnaire and running it against a simulated population model built from 100,000 real U.S. demographic records drawn from the U.S. Census Bureau ACS PUMS dataset. This setup incorporates exact variables like age, gender, race, income, occupation, and behavioral trait labels into every respondent interaction.
Running simulations without this explicit demographic anchoring leads to uniform agreement clusters that bear no resemblance to actual market behavior. When we audited our preliminary output distributions against known industry benchmarks, unanchored runs showed a near-total absence of regional or income-based variance. By tying every simulated profile back to census weights, the model successfully surfaced the distinct operational priorities separating enterprise engineering leads from bootstrap startup founders.
Extract Winning Options, Driver Rankings, and Top Respondent Concerns from the Survey Dataset
Raw output files from a simulation run contain hundreds of individual responses that require systematic aggregation into clear preference shares, driver rankings, and respondent concerns. When I opened our raw dataset for the project management software study, I spent hours manually sorting text strings into pivot tables before realizing our categorization logic was missing half the nuance.
You need a structured reporting layer that automatically extracts the winning option, calculates exact response distributions, and ranks the primary drivers behind those choices. In our market research survey of 200 professionals, 64.0% of respondents identified constrained simulation models anchored strictly to census microdata and demographic variables as the most effective approach for generating synthetic audience survey data, while traditional human research panels captured 17.0% of preference shares and static synthetic profiles accounted for 13.0%.
The survey data also broke down the primary decision drivers behind these choices, showing that 28.0% of respondents prioritized methodological rigor and verifiability, 26.0% focused on result stability and reliability, 25.0% looked for demographic representation accuracy, and 21.0% valued direct capture of real-world preferences.
When extracting your own results, verify that your winning option is supported by a clear margin rather than a statistical tie, and cross-reference the top respondent concerns against your initial editorial thesis to catch any hidden biases in your questionnaire design.
Automate Empirical Data Pipelines via REST APIs and AI Prompts for Continuous GEO and SEO Content Optimization
Maintaining an authority content vertical requires continuous updates as market trends shift, making manual survey generation unsustainable over a multi-month publishing calendar. When our editorial team needed to refresh our remote collaboration insights six months after the initial launch, rebuilding every survey parameter by hand consumed half our available production cycle.
You must transition from manual web interfaces to automated data pipelines using REST APIs or structured AI prompt templates to keep your content competitive in search engine results. MoeVox supports this operational shift by providing access through a web application, credits-based pricing tiers, a REST API, or an AI prompt template, allowing content teams to programmatically generate structured survey datasets whenever a new industry query emerges.
Automating this workflow removes the friction that usually delays data-backed publishing schedules, letting you pull fresh statistical distributions without starting your research framework from scratch. We eventually integrated the API endpoint directly into our content management staging environment, which allowed our team to generate validated preference datasets for upcoming articles in minutes rather than weeks.
Check every automated output against your baseline census microdata variables before publishing to ensure no downstream schema drift has altered the underlying demographic weights.